The chances are you already know what a histogram is or at least where you’re likely to encounter one, but do you really understand what it means and how it can help your photography?
Where do I find the histogram?
In Photoshop the histogram will appear in a couple of places but most of us will be more familiar with the histogram that appears when we press CTRL+L and open Levels.
.jpg)
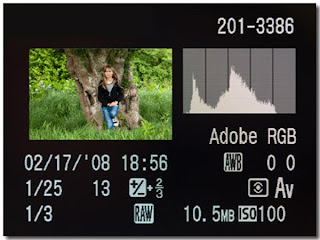
The chances are your camera will also offer a histogram view of your images and it’s that we’re going to be focusing on in this article. How you access the histogram on your camera will vary depending on the make and model, so if you don’t know how to find it on your camera go back and read your cameras manual.
So why should you be interested in the histogram? Because your camera’s LCD tells you lies, that’s why.
Who hasn’t looked at their images on the back of the camera and believed their images look great only to get home and discover the horrible truth… Your images are poorly exposed.
Remember, use your cameras LCD to check a photos composition, use the cameras Histogram to check exposure.
What is a Histogram?
In its simplest form a histogram is a graph which shows brightness across your image. The left side of the graph represents the dark tones, the centre shows the mid tones and the right is the light tones.
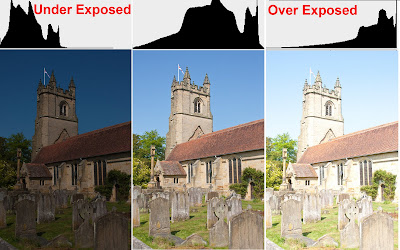
Lets start with a nice snapshot of a general scene, it’s got a big blue sky and nice green grass. In an ideal world a correctly exposed photograph will have a histogram with a fairly smooth curve which touches both edges and peaks towards the centre. That would indicate the image has a full range of tones and good contrast.
.jpg)
A histogram which is weighted more to the left would usually indicate an underexposed image, where as a histogram weighted to the right usually indicates an overexposed image. If you see either of these you need to think about altering the cameras exposure compensation.
The histogram trap.Once you’ve mastered the basic skills in reading a histogram, you’ll be able to check your images on the cameras LCD and be pretty confident you have captured a good image before moving on. But a little knowledge can be a dangerous thing and in photography that means you’ll need to understand what your photographing before deciding that the histogram is telling you that the exposure is incorrect.
.jpg)
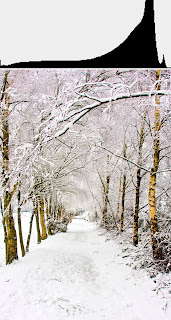
Take this image. There is a large amount of light tones in the image, which needs to be considered when looking at the histogram. A correct exposure would have the histogram graph pushed towards the right hand side. If the graph was a neatly centred histogram (like our first image) we would actually have an under exposed image.
Don’t fall into the trap of believing that because the histogram is pushed to the right side it automatically means that your exposure is wrong. It just means there’s a lot lighter tones in the image. You have to read the image as well as the histogram.
.jpg)
Conversely this is a very dark image so the histogram is pushed to the left. Once again it’s correctly exposed.
Understanding your histogram will allow you to capture better images and spend less time adjusting them in Photoshop and that’s got to be a good thing.
 I'm very pleased to be todays guest blog poster over at Tip Squirrel.com


.jpg)
.jpg)
.jpg)
.jpg)